 Huankai Chen
Every trade, as it happens
AboveEntry, exit, how long it was held, what it made. Winners and losers are listed the same way.
Straight from the trading database
I built a trading strategy. I don’t know yet whether it holds up. So instead of telling you it works, I’m running it for 30 trading days on a demo account and putting every day on this page — the good ones and the ones that go backwards.
Demo account. Not real money, not advice, and not a claim that this works.
Decision log
risk_cycle
Risk budget for this cycle intact
position_cap
Open positions within the cap
spread_guard
Spread inside tolerance
session_window
Outside session — refused and logged
Running on
I’m Huankai. I build software, and for the last while I’ve been building a trading system because the problem interested me — not because I had a plan to sell anything.
The honest ambition is small: I’d like something that quietly covers the day. Three meals, not a yacht. That target is modest enough to be testable, which is exactly why I picked it.
The strategy is still being tuned. It has never traded real money. Rather than keep refining it privately and eventually announcing a number nobody can check, I’d rather run it in public for 30 trading days and let the result be whatever it is.
If it works, there’ll be something worth talking about. If it doesn’t, that will be on this page too, in the same size type.
Huankai ChenLinkedIn →
The desk above shows what the strategy did and how it went. How it decides stays private — that part is the only thing worth keeping.
Entry, exit, how long it was held, what it made. Winners and losers are listed the same way.
Straight from the trading database
One bar per day against the £100 line. Days the market was shut are left empty rather than drawn as zero.
Click a day to read it back
Maximum drawdown sits next to the return. A panel showing only the good number is not worth reading.
From the realised equity curve
Trades the system declined are logged with the reason. Not placing an order is a decision too.
The rules themselves stay private
Leave an email and I’ll write once when the run ends, with the result either way. That’s the whole list — no newsletter, no forwarding, delete any time.
Rather talk, or want to see how it’s built?
Find me on LinkedInThe entry logic stays private, but the constraints around it do not. These four decide how badly this can go wrong.
Each cycle’s risk budget is fixed in advance. No signal can raise it.
Every gate has to say yes explicitly. Missing an answer is a no, not a yes.
Local state is checked against the broker each cycle. A mismatch stops trading.
Declined trades are written down with their reason, so the quiet days can be audited too.
A2-TECH100-MIX-001 has never traded real money, has never run a validated out-of-sample test, and its measured edge on the available data is not statistically distinguishable from zero.
That interval crosses zero, and it governs everything else on this page: on four days of data, £436.30 is not distinguishable from nothing. The 30-day run above is an attempt to find out — not proof that the question is settled.
FAQ
Including the awkward ones.
No. It’s a demo account with a simulated £10,000 balance. No broker order is placed with real funds.
Because it’s small enough to be a real test rather than a fantasy, and because it’s roughly what I’d want a side project to quietly cover. A target you can actually check is worth more than an impressive one you can’t.
Thirty trading days. Weekends and market holidays are not days of the run — the market being shut is not a day the strategy was given and missed. That’s why the clock in the header shows more calendar time left than the day counter suggests.
I publish the result, whatever it is, and say what I learned. If it’s bad, that’s the more useful write-up anyway.
Because the moment it’s public, anyone can run it against me in the same market. What’s published here is the outcome and the discipline, not the entry conditions.
No. The v1 entry path contains no machine learning — no model, no fitted weights, no confidence score. Five AI experiments were run against this market and all of them failed.
There’s nothing to buy. No price, no launch date, no pre-orders. The list is for one email at the end of the run.
No. The system is real and complete; the result is not established. That’s the entire reason for doing this in public.
Stored with the time you signed up, used for one message at the end of the run. Not forwarded, not a newsletter, deleted on request.
Elsewhere
A²PT is one of these. The others are live, most of them for someone other than me, and they are the reason I think this one is worth trying.
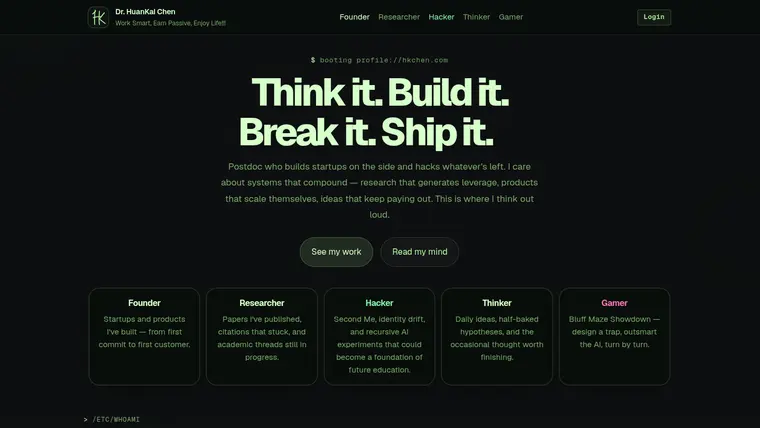 hkchen.comPersonal siteThink it. Build it. Break it. Ship it.
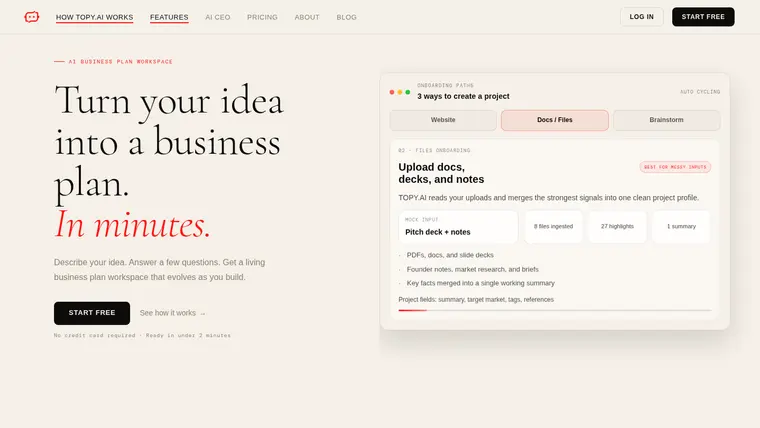 TOPY.AIProductTurns an idea into a business plan in minutes.
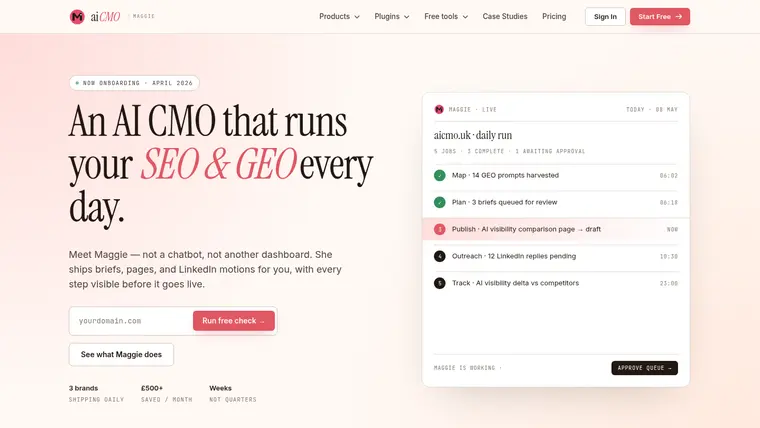 AI CMOProductRuns a brand’s SEO and GEO every day, with every step visible.
 DHAHABYFintechGold-backed finance for the GCC: borrow against gold you already own.
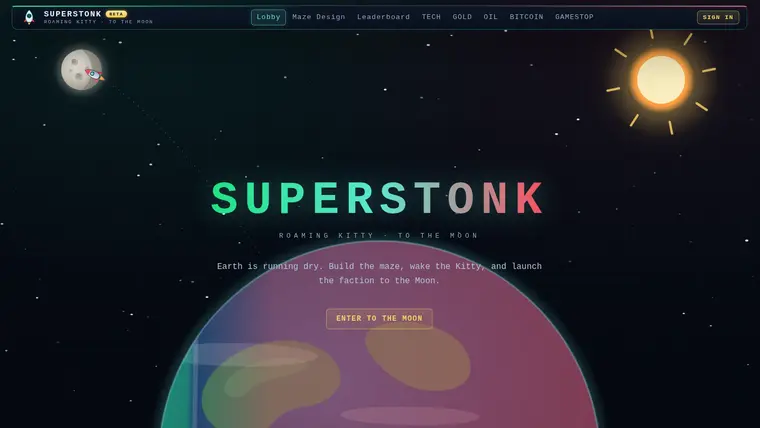 SuperStonkSister projectThe market desk this page reads its data from.
 bea.giftMarketplaceUK spas and salons, with treatments and prices up front.
 Spa Chevy ChaseClient siteMassage, facials and acupuncture in Chevy Chase.
 ORA Retreat HouseClient siteA private wellness house in St John’s Wood.